If this is your first visit, be sure to
check out the FAQ by clicking the
link above. You may have to register
before you can post: click the register link above to proceed. To start viewing messages,
select the forum that you want to visit from the selection below.
avg. per carry is a reliable stat 99% of the time. Smeefers is wrong and you agreed with him. Backs don't have so many long runs that it skews the normal loss of 3. Just doesn't happen.
OK, you're saying that the median and mean converge to the same number.
What I know for sure is that in a single game's stats, the median would be a much better indicator of how the runner is doing, and I suppose you agree. A guy breaks one long run and he's aces in the average stat.
I am not so sure about a whole season where you get 300 carries because I don't know what the distributions typically look like. But one 30 yard run still does make-up for 6 one yard losses. I wouldn't call a back who performed that way anything to write home about. I think I'm right, median would be a better indicator of a back's quality/reliability for a whole season. But more info needed to prove that guess.
OK, you're saying that the median and mean converge to the same number.
Mean is the number most people call the 'average'. Median is the number in the middle number in the set when you put them in ascending order - the median of {1,3,5} is 3, the same as the mean/average, but the median of {1,3,25} is also 3, while the mean/average would be 9.
Do they converge? On a large set of a stat like yards/carry I guess they might. I think the median would be a little lower than the average.
Mean is the number most people call the 'average'. Median is the number in the middle number in the set when you put them in ascending order - the mean of {1,3,5} is 3, the same as the average, The mean of {1,3,25} is also 3.
I think you are going to have repeat your stats class.
"Never, never ever support a punk like mraynrand. Rather be as I am and feel real sympathy for his sickness." - Woodbuck
Mean is the number most people call the 'average'. Median is the number in the middle number in the set when you put them in ascending order - the mean of {1,3,5} is 3, the same as the average, The mean of {1,3,25} is also 3.
Right, I just had a pre-senior moment and used the word "mean" when I meant "median." I misspoke, as they say. But I'm on to frying bigger fish...
Turns out that my intuition was wrong. Median would be good for a game, but is not useful at all for a season, because all backs land at about 3 ypc!
This post follows a discussion of how to rate running back performance (or team rushing performance) that began at PFR and continued at Sma...
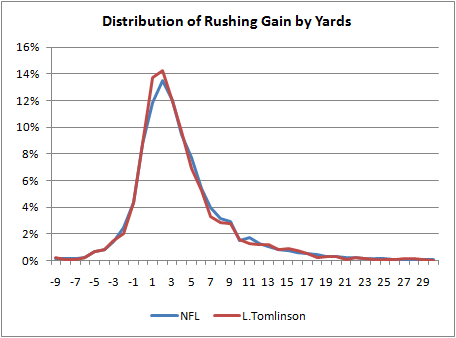
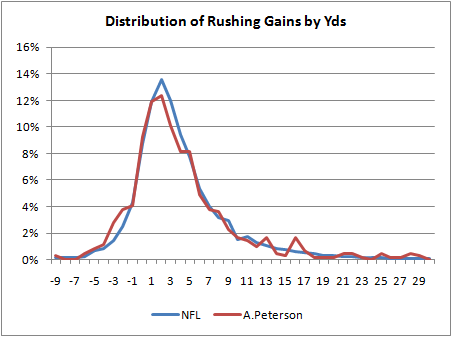
That article is damn interesting. Here's some sample distributions, amazing how close backs follow the NFL total distribution:
These results aren't all that shocking: The distribution of a ton of data is going to approximate a normal distribution, and the successful running teams/runners are going to mostly determine the mean of the curve, so they will map onto it pretty closely. I think you would find the exact same thing for receptions by WRs. Now map on the sucky runners from GB!
But it proves my point: averages and medians are misleading. Go and look at the individual runs, the circumstances, and how they impact games. Barry Sanders sucked because his median was low: 1,1, -4, 12, 1, 4,1,38, 2, 60, 1, -1, -5,3, 45 - that's what his stat line looked like sometimes. Jerome Bettis looked like: 3,3,4,6,3,7,2,9,3,4,7,2,4,5,6...etc. Who was better??
"Never, never ever support a punk like mraynrand. Rather be as I am and feel real sympathy for his sickness." - Woodbuck
These results aren't all that shocking: The distribution of a ton of data is going to approximate a normal distribution,
no, it will look like the underlying distribution, which may or may not be normal.
And there is no reason to suspect that there would be so little difference in distributions between individual players. Doesn't matter how much data you collect.
The similarity is shocking, and I see now the author of that article agrees.
Also, my intuition was correct on one point: average ypc is heavily determined by outliers (long runs), even for a whole season, according to that article.
Barry Sanders sucked because his median was low: 1,1, -4, 12, 1, 4,1,38, 2, 60, 1, -1, -5,3, 45 - that's what his stat line looked like sometimes. Jerome Bettis looked like: 3,3,4,6,3,7,2,9,3,4,7,2,4,5,6...etc. Who was better??
These results aren't all that shocking: The distribution of a ton of data is going to approximate a normal distribution, and the successful running teams/runners are going to mostly determine the mean of the curve, so they will map onto it pretty closely. I think you would find the exact same thing for receptions by WRs. Now map on the sucky runners from GB!
But it proves my point: averages and medians are misleading. Go and look at the individual runs, the circumstances, and how they impact games. Barry Sanders sucked because his median was low: 1,1, -4, 12, 1, 4,1,38, 2, 60, 1, -1, -5,3, 45 - that's what his stat line looked like sometimes. Jerome Bettis looked like: 3,3,4,6,3,7,2,9,3,4,7,2,4,5,6...etc. Who was better??
The interesting part is that the way they've laid it out, it looks like RB success is dependent on their ability to break a long run, since most of the runs will end up being 3.3yds anyways. LT's graph looks particularly bad, and you don't know what made him special unless you read the article and see that 1.5% of his runs were for >30yds...which is not shown on the graph.
--
Imagine for a moment a world without hypothetical situations...
no, it will look like the underlying distribution, which may or may not be normal.
And there is no reason to suspect that there would be so little difference in distributions between individual players.
Is there? you selected three - three of the most productive backs. Do all runners map exactly the same? If so, then again, I'm correct - it is the circumstances of the particular runs, and not the averages, means, or distributions (normal or otherwise, but looks like normal from the graph) that make the difference. Still, you can see suggestions of those distinctions in the overlaid graphs - a collection of long runs for Peterson, a slightly shifted peak for Westbrook, for example. LT: perhaps he just got more carries. What do the bad runners look like?
"Never, never ever support a punk like mraynrand. Rather be as I am and feel real sympathy for his sickness." - Woodbuck
Is there? you selected three - three of the most productive backs. Do all runners map exactly the same? If so, then again, I'm correct - it is the circumstances of the particular runs, and not the averages, means, or distributions (normal or otherwise, but looks like normal from the graph) that make the difference. Still, you can see suggestions of those distinctions in the overlaid graphs - a collection of long runs for Peterson, a slightly shifted peak for Westbrook, for example. LT: perhaps he just got more carries. What do the bad runners look like?
It's interesting that you chose the Bus. The Bettis-Lacy comparison has started coming up since Saturday.
When the going gets weird, the weird turn pro ~Hunter S.
The interesting part is that the way they've laid it out, it looks like RB success is dependent on their ability to break a long run, since most of the runs will end up being 3.3yds anyways.
some of the differences are apparent. But the graph is made from the entire NFL, and it seems averages will be skewed to the teams that run more/better.
I still say that the worst way to compare/evaluate runners, or the effectiveness of a running game, is by the stats. Just watch the games.
"Never, never ever support a punk like mraynrand. Rather be as I am and feel real sympathy for his sickness." - Woodbuck
It's interesting that you chose the Bus. The Bettis-Lacy comparison has started coming up since Saturday.
Sanders and Bettis were the first guys I could think of who were effective, but ran so differently. Explosive versus steady, both effective, but misleadingly different (median, range) or the same (average) statistically.
"Never, never ever support a punk like mraynrand. Rather be as I am and feel real sympathy for his sickness." - Woodbuck
 Tweet
Tweet


Comment